
Football predictions are most useful when they explain the evidence behind a forecast. This educational guide shows how to combine team form, expected goals, tactics, squad news and market prices without pretending that any outcome is certain.
What makes a useful football prediction?
A prediction is a reasoned assessment of possible outcomes, not a promise about what will happen. A strong forecast makes its assumptions visible, distinguishes observations from estimates, and identifies circumstances that might invalidate its conclusion. Saying that a side has won four of its last five matches is descriptive; explaining how its chance creation, opposition quality and current squad combine to affect the next fixture is analytical. Readers should be able to see the evidence behind a recommendation and decide whether they agree with it.
The three-way home-draw-away market is particularly demanding because the draw remains a meaningful possibility. A favourite can dominate possession and shots yet fail to win. Equally, a low-scoring team can win through a set piece or defensive mistake. The objective is to assess uncertainty rather than disguise it.
Build the evidence base before choosing a market
Start with the date, competition, venue and confirmed fixture. Then examine a suitable run of home and away performances, while considering the strength of opponents. A recent victory over an injury-hit side should not carry exactly the same interpretive weight as a comparable performance against a strong, settled opponent. Check whether the available data covers the current season and whether cup matches, friendlies or youth fixtures have been mixed into league figures.
Use a compact checklist: goals for and against, shot volume, shots on target, expected goals, expected goals conceded, clean sheets, scoring frequency and first-half performance. None of these measures should be treated as decisive on its own. A small sample can be distorted by red cards, penalties or unusual finishing. Record the source and retrieval date so later readers know what information was available at the time.
Understand expected goals without overclaiming
Expected goals, commonly called xG, assigns an estimated scoring likelihood to each attempt based on characteristics of the chance. A close-range shot generally receives a higher estimate than an attempt from a difficult angle, although the precise value depends on the model. Adding the shot values gives a team’s total match xG. Expected goals against, or xGA, applies the same idea to chances conceded.

Suppose a hypothetical side records 1.8 xG but scores once. That does not prove it was unlucky or guarantee more goals next week. It simply indicates that the recorded chances had a combined expected value of 1.8 goals under that model. Finishing skill, goalkeeping, chance selection and random variation all matter. Comparing rolling xG and xGA can be useful, but the data provider and sample size should be consistent.
Read the tactical match-up, not just the league table
Football styles interact. A team that presses high may be effective against opponents who insist on building slowly from their goalkeeper, yet vulnerable to direct passes into space behind the defence. A side that creates most chances through wide crosses may struggle against a defence with strong aerial organisation. Watch how teams progress the ball, defend transitions and protect the central areas.
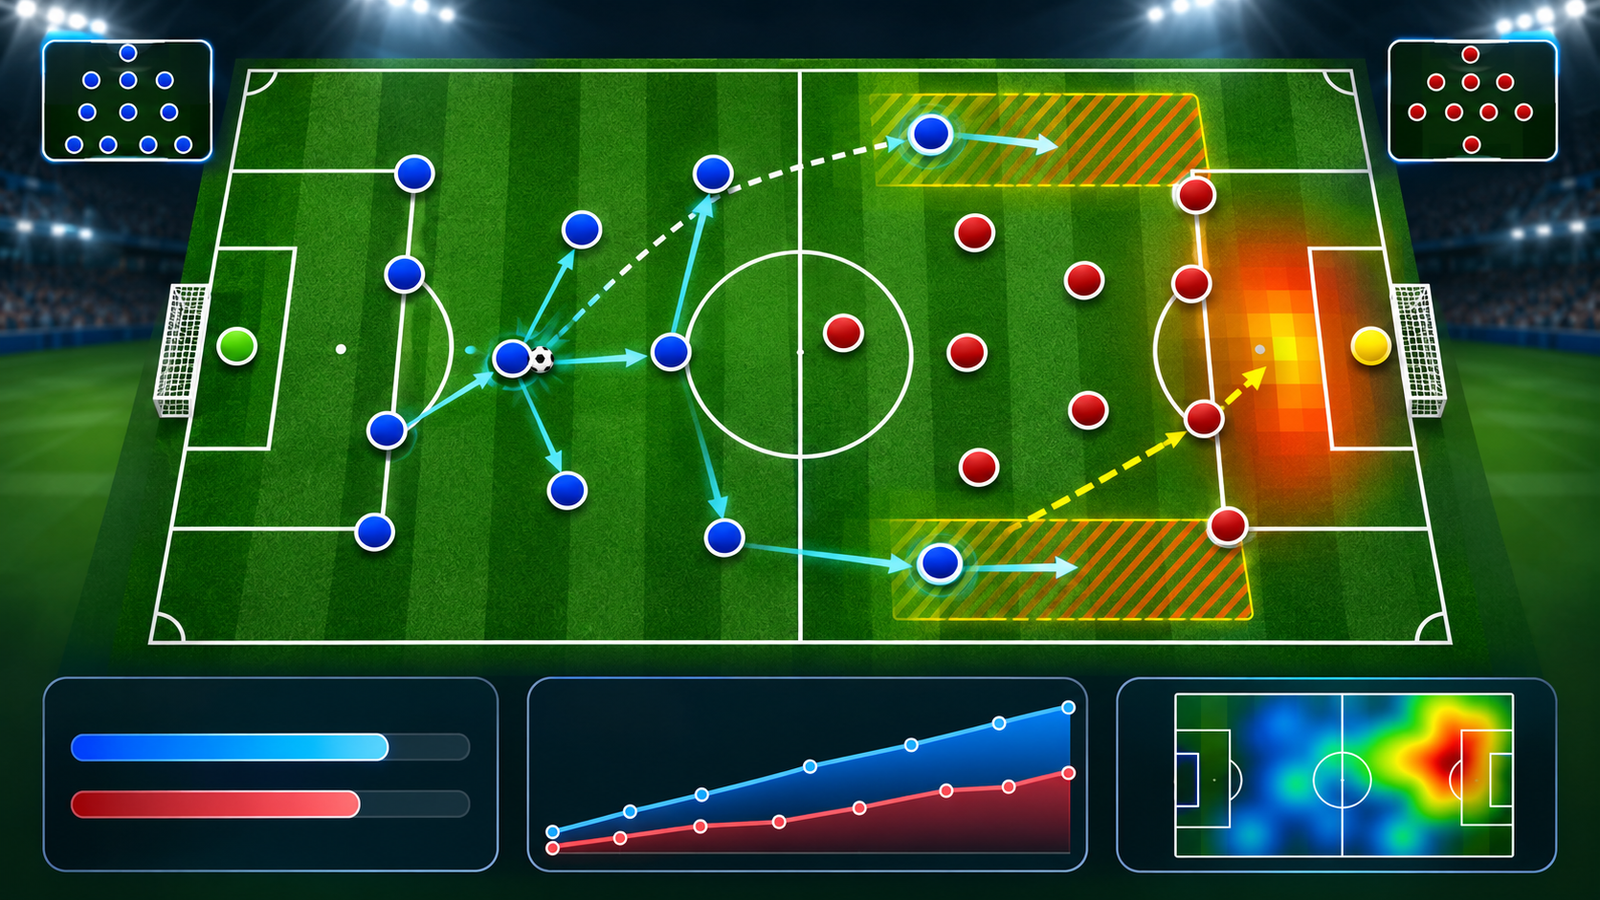
Ask where each side expects to create numerical advantages. Are the full-backs encouraged to attack? Can the holding midfielder cover the space they leave? Does a striker stretch the defence or prefer receiving with their back to goal? These questions help explain why two teams with similar recent records might produce very different matches. Our situational match analysis explores how tactical context and squad circumstances alter a pre-match assessment.
Separate the result market from goals markets
A likely winner is not necessarily a high-scoring winner. A team with a disciplined defence and limited attacking ambition might be favoured in a fixture that projects as relatively low scoring. Conversely, two defensively vulnerable teams could offer an interesting goals discussion even when the match winner is difficult to identify.
For Over 1.5 goals, at least two goals are required. Over 2.5 needs three or more. Both teams to score requires each side to register at least once, so a 3–0 result wins Over 2.5 but loses BTTS. Examine the distribution of chances, attacking availability, defensive structure and match incentives before selecting a market. See the Over/Under 2.5 goals strategy for a more focused explanation.
Why first-half predictions need their own research
Early goals are influenced by starting intensity, tactical caution and how quickly a side establishes territory. A team may score frequently overall but produce much of its threat after substitutions. Another may begin aggressively and fade as the match develops. Full-time goal averages cannot simply be divided in half to predict first-half outcomes.
Study first-half shot creation, early concessions, opening formations and the quality of opposition. Be cautious with short runs of matches: one unusually open fixture can shift the average substantially. Our First-Half Goal Index provides a dedicated starting point for researching early-scoring patterns rather than extrapolating from full-time results.
Adjust for injuries, rotation and incentives
Line-ups can transform a forecast. Losing a goalkeeper, centre-back pairing or creative midfielder may alter the team’s expected performance. In cup competitions, managers may rotate heavily; in congested schedules, recovery time and travel may influence intensity. Do not assume a star player’s absence has a fixed numerical impact across all opponents.
Check reliable club announcements and confirmed teams close to kick-off. Distinguish a rumoured injury from a verified absence. Consider motivation carefully: a team needing points does not automatically become more likely to win, and a side with little to play for may still perform well. Motivation is a contextual factor, not a substitute for evidence.
Turn analysis into an explicit probability judgement
A good forecasting process states what it believes and why. For a three-way market, the home, draw and away probabilities should total 100%. If the assessment is only qualitative, use terms such as slight favourite or competitive fixture instead of inventing precise percentages. A numerical probability without a calibrated model can give readers a false sense of certainty.
Consider a hypothetical estimate of 60% for a home win. Its fair decimal price is approximately 1.67, calculated as one divided by 0.60. This is not a real match prediction. If the bookmaker price is shorter, there may be little value even if the team is the favourite. Odds include margin, and the model’s own error may be substantial. Evaluate the price and the quality of the estimate together.
Avoid the accumulator confidence trap
Combining several selections multiplies the ways a ticket can lose. If three independent hypothetical events each had a 70% chance, the probability of all three occurring would be 0.7 × 0.7 × 0.7, or 34.3%. Real selections are not always independent, especially when markets share the same match or underlying assumptions.

Do not label an accumulator safe merely because its individual legs look plausible. Check settlement rules, correlated outcomes, prices and the effect of one unexpected event. A smaller, clearly reasoned selection may be easier to evaluate than a large collection of favourites. No staking plan can remove the underlying risk.
Keep a prediction log and test calibration
Record the fixture, market, quoted odds, estimated probability, key evidence, result and any significant late team news. This helps separate a sound process that experienced a losing outcome from a weak process that happened to win. Over time, compare predictions grouped by probability: outcomes estimated around 60% should occur near that rate across a sufficiently large, representative sample if the model is well calibrated.
Track return on investment alongside hit rate, but remember that both can fluctuate sharply over small samples. Avoid retroactively editing the original forecast after seeing the result. The Football Intelligence Reports section offers additional examples of match research and evidence-led assessments.
A practical pre-match workflow
Begin by confirming the fixture and data sources. Compare home and away profiles and identify the principal attacking and defensive strengths. Examine xG trends, recent opposition, tactical compatibility and expected line-ups. Select the market only after these steps, then check whether the price fairly reflects the estimated uncertainty.
Finally, write down what would change your mind: a key player missing, unexpected rotation, a tactical reshuffle or a substantial price movement. If the evidence is incomplete, passing on the fixture is a valid conclusion. For a broader introduction to the methods available on the site, browse the Premier Betting Tips strategy hub.
Frequently asked questions
Are football predictions guaranteed?
No. Football is uncertain and even well-researched forecasts can fail.
Is xG better than recent results?
Neither should be used alone. xG helps describe chance quality, while results and tactical context provide additional information.
What is the difference between BTTS and Over 2.5?
BTTS needs both teams to score; Over 2.5 needs at least three total goals, regardless of which side scores them.
When should I update a prediction?
Review it after meaningful team news, confirmed line-ups or a material change in market prices.
Can I use the same analysis for accumulators?
Individual-match research is a starting point, but accumulators also require careful attention to combined probability and dependence between selections.
Related Football Strategies
- Situational Match Analysis — team news, tactics and fixture context.
- Over/Under 2.5 Goals Strategy — understanding three-goal thresholds.
- First-Half Goal Index — early scoring patterns.
- Football Intelligence Reports — evidence-led match research.
Conclusion
Better football predictions begin with better questions. Verify the fixture, compare meaningful statistics, assess the tactical match-up and acknowledge what the available evidence cannot establish. A transparent decision to avoid a market is often more useful than a confident-sounding guess.
Responsible betting: Gambling involves financial risk and no system guarantees profit. Only gamble what you can afford to lose, never chase losses and seek help at GambleAware if needed.